Usage
Overview
Once you have understood the concepts explained in Pipelines, Rules, and Stream connections, you are ready to start creating your own processing pipelines. This page gives you the information you need to get started with the user interface.
Configuration
Configure the message processor
Before start using the processing pipelines you need to ensure the message processor is enabled and correctly configured. You can do so by going to the System -> Configurations page, and check the configuration in the Message Processors Configuration section.
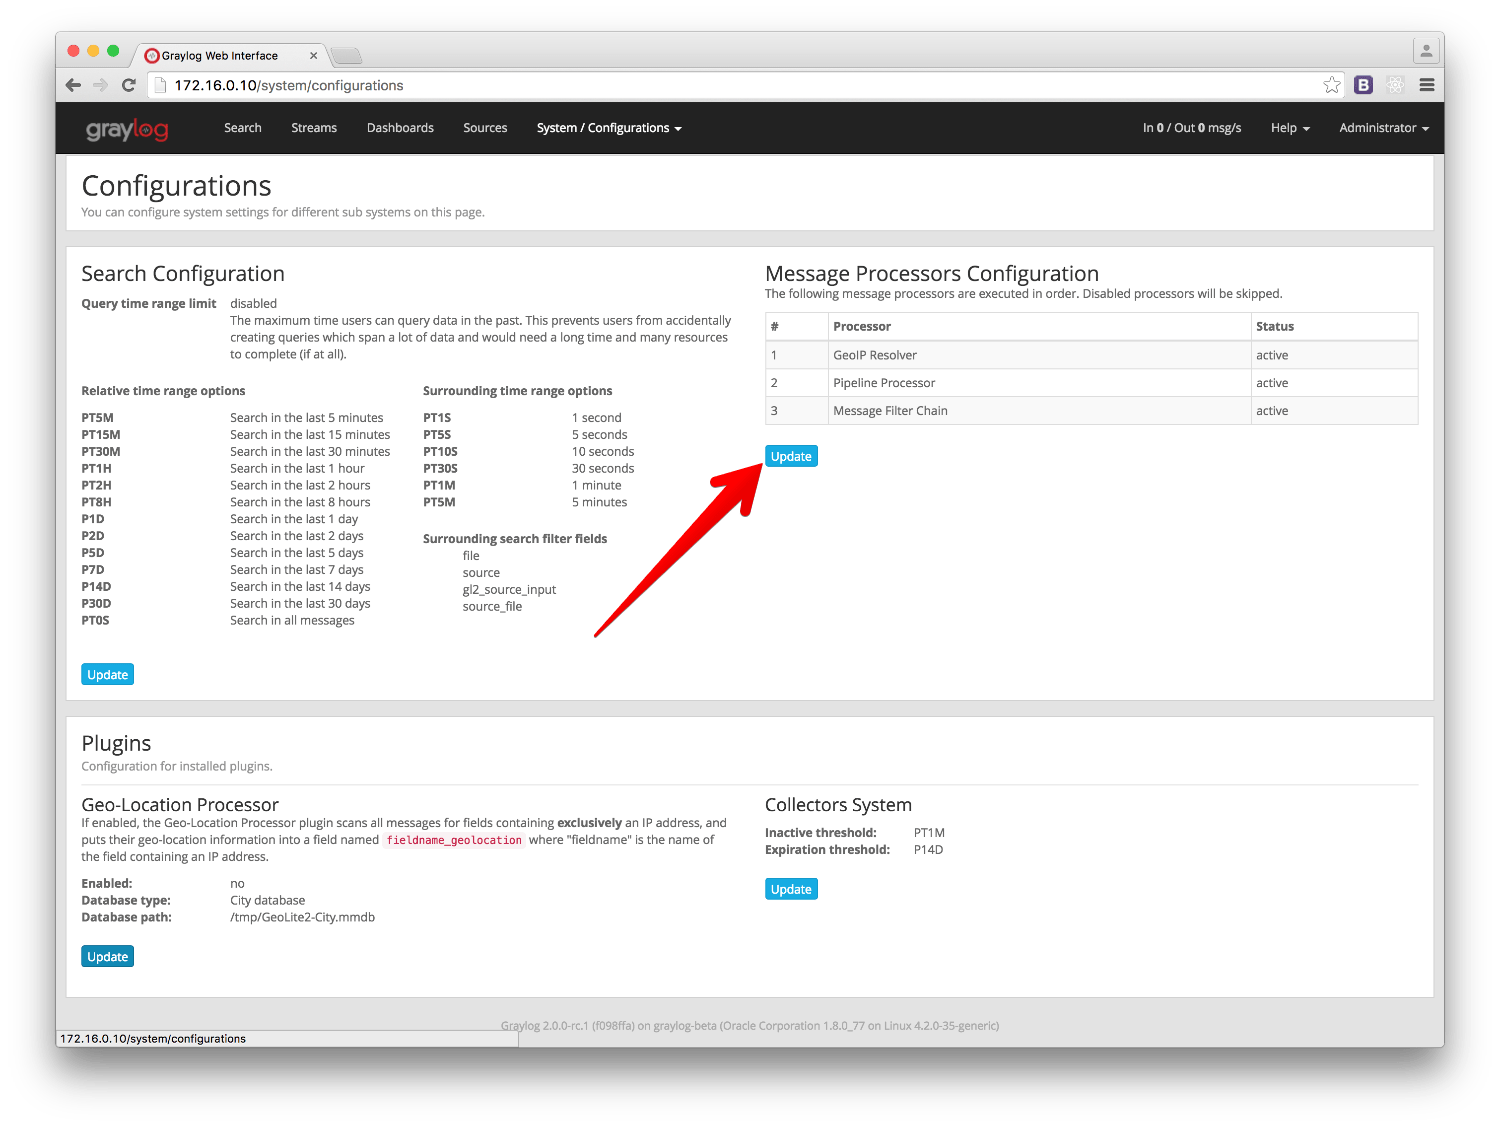
In that screen, you need to enable the Pipeline Processor message processor, and you must also set the Pipeline Processor after the Message Filter Chain, if you want to be able to use pipelines in your streams, and get access to fields coming from extractors.
Manage rules
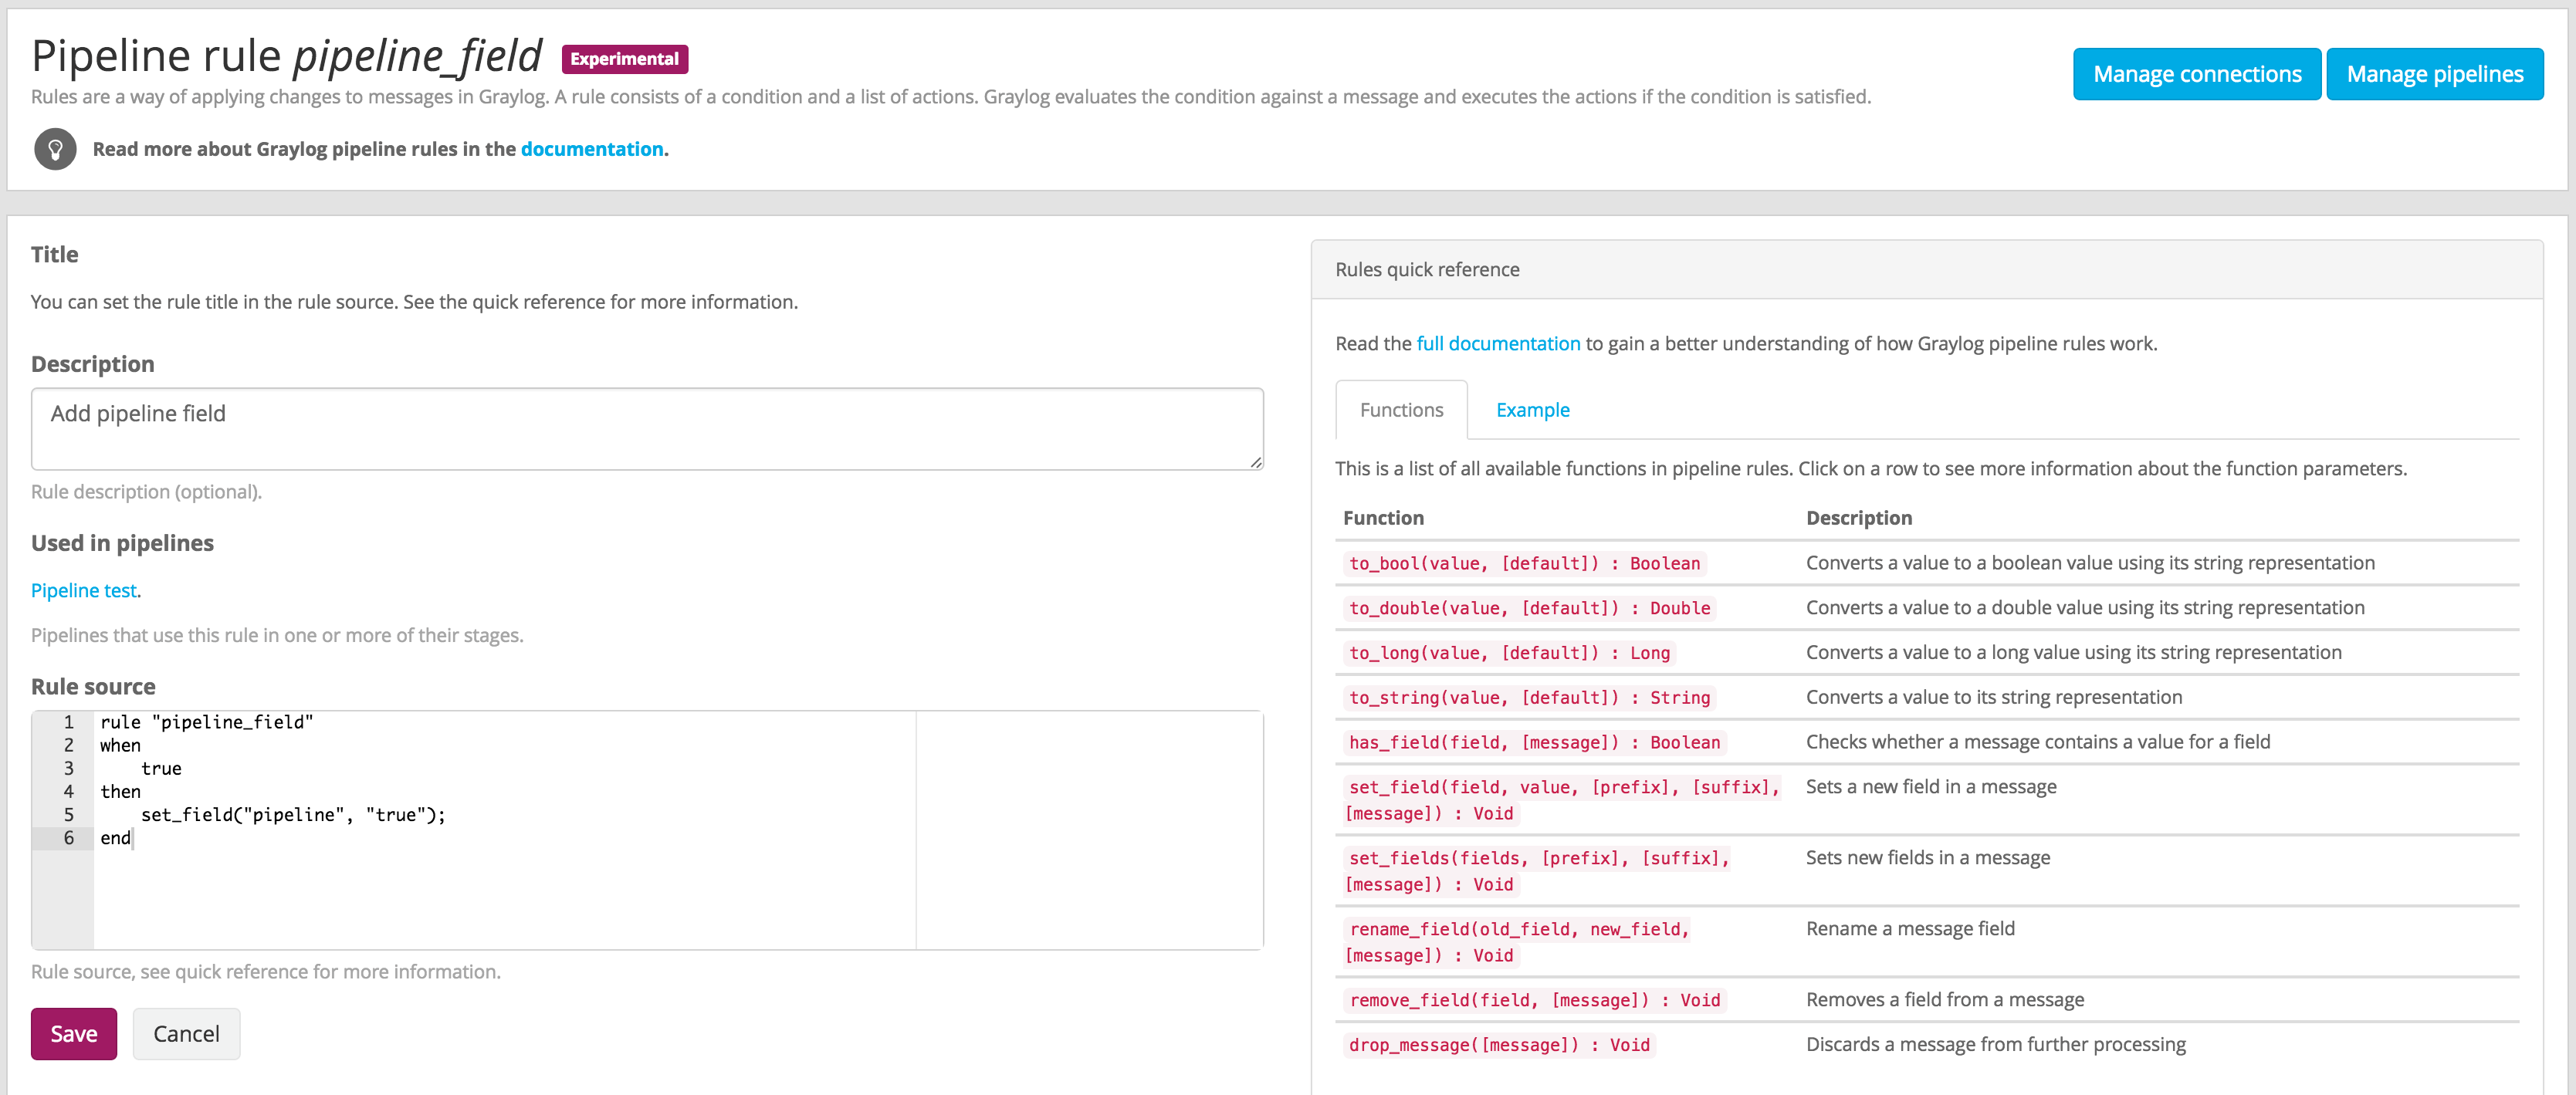
You can create, edit, and delete your pipeline rules in the Manage rules page, under System -> Pipelines.
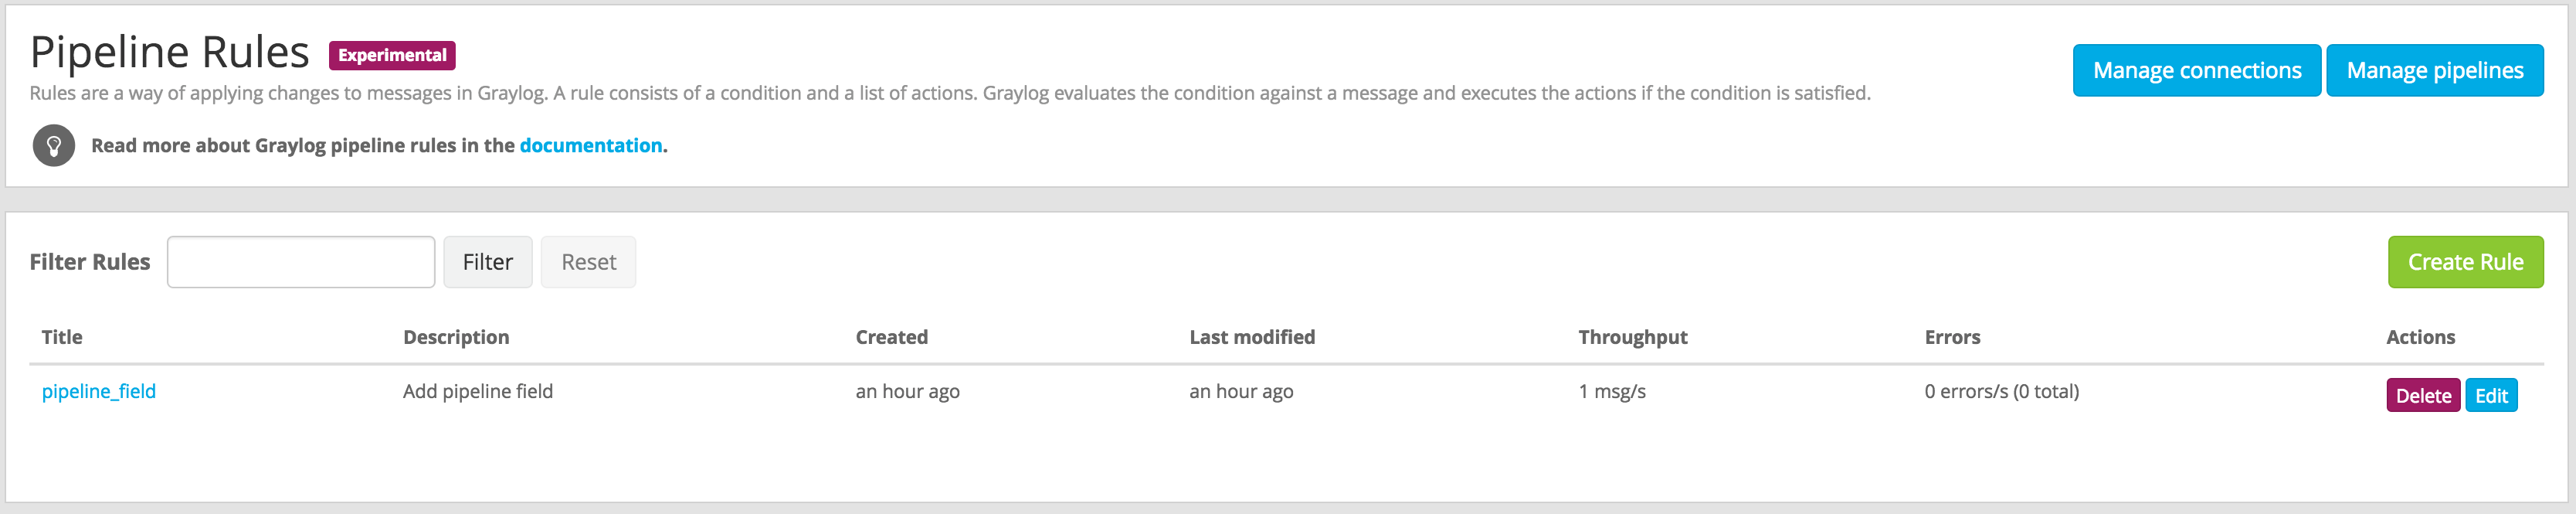
Clicking on Create Rule or Edit in one of the rules will open a page where you can write your own rule, alongside with some documentation to make the task a bit more manageable.
Managing pipelines
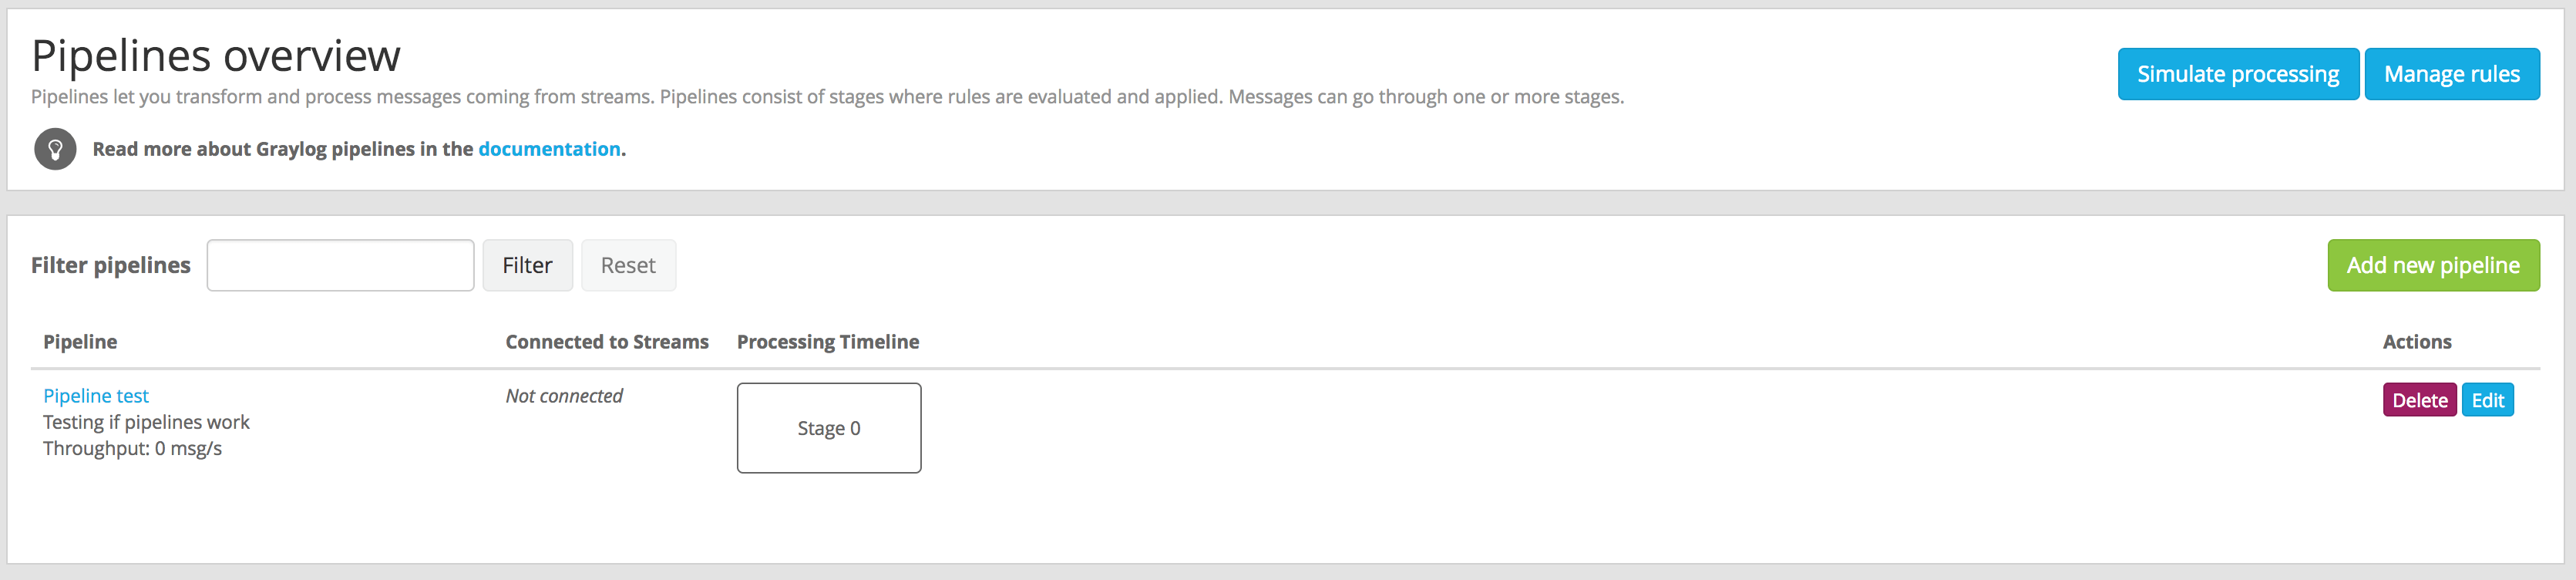
Once there are some rules in Graylog, you can create pipelines that use them to modify and enrich your messages.
To manage your pipelines, access Manage pipelines page under System -> Pipelines. From that page you can create new pipelines, edit existing ones, and delete pipelines you don’t need any more.
In order to create or edit pipelines, and as explained in Pipelines, you need to add your rules into a stage with a certain priority. The Web Interface will let you add rules to the default stage (0), and to create new stages with different priorities.
A pipeline can have more than one stage, and when you create or edit a stage you need to select how to proceed to the next stage in the pipeline:
- All rules on this stage match the message
- This option will only consider further stages in the pipeline when all conditions in rules
evaluated in this stage are
true. This equals tomatch allin the Pipelines section. - At least one of the rules on this stage matches the message
- Selecting this option will continue to further stages in the pipeline when one or more of the
conditions in rules evaluated in this stage are
true. This equals tomatch eitherin the Pipelines section.
Connect pipelines to streams
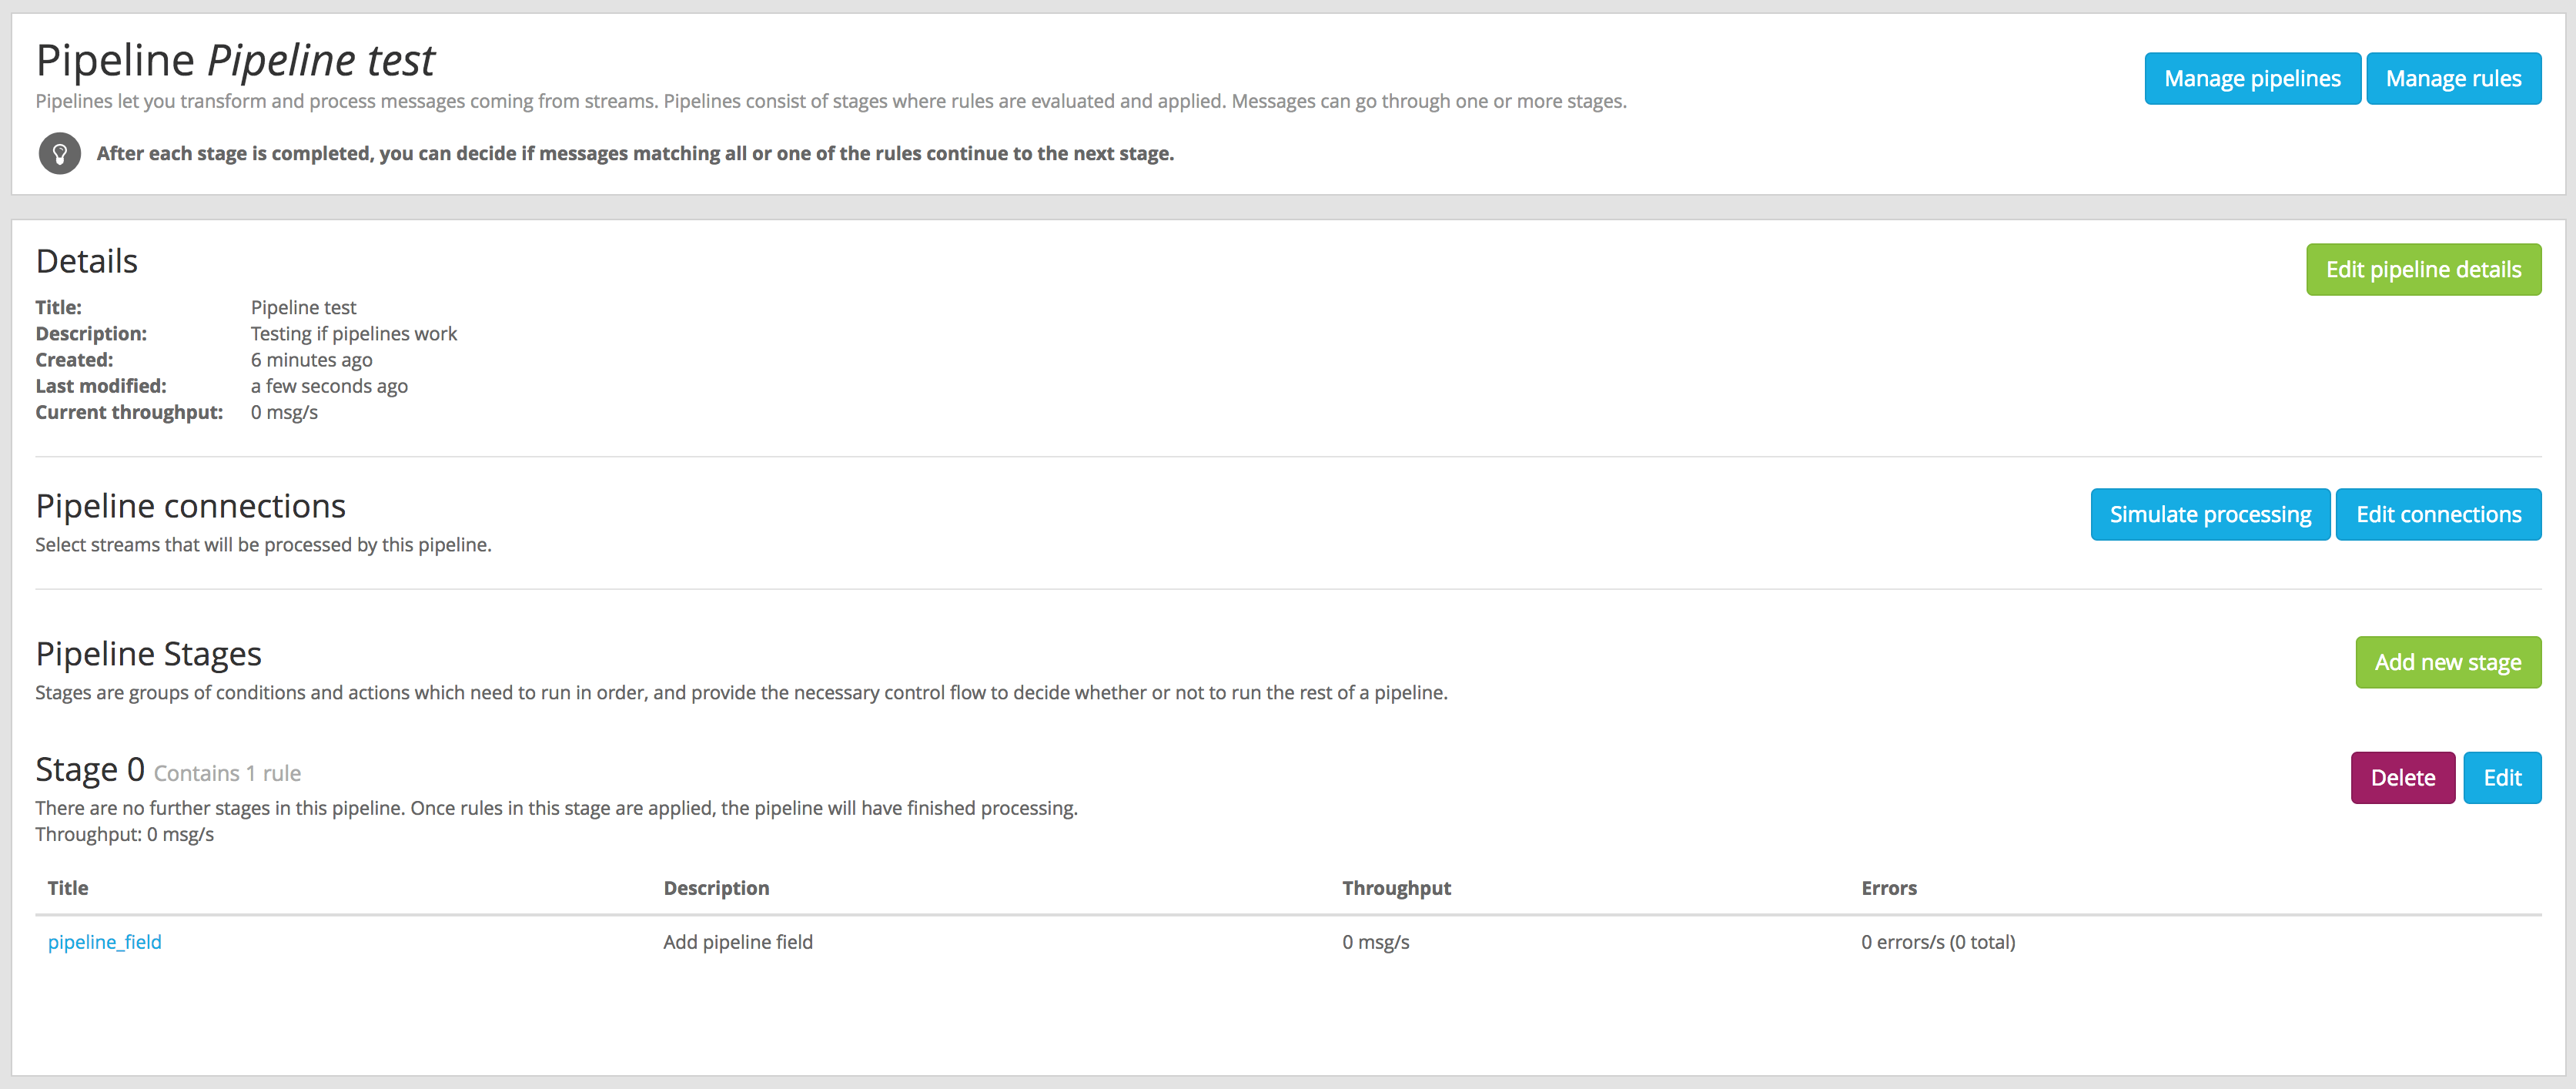
You can decide which streams are connected to a pipeline from the pipeline details page. Under System -> Pipelines, click on the title of the pipeline you want to connect to a stream, and then click on the Edit connections button.
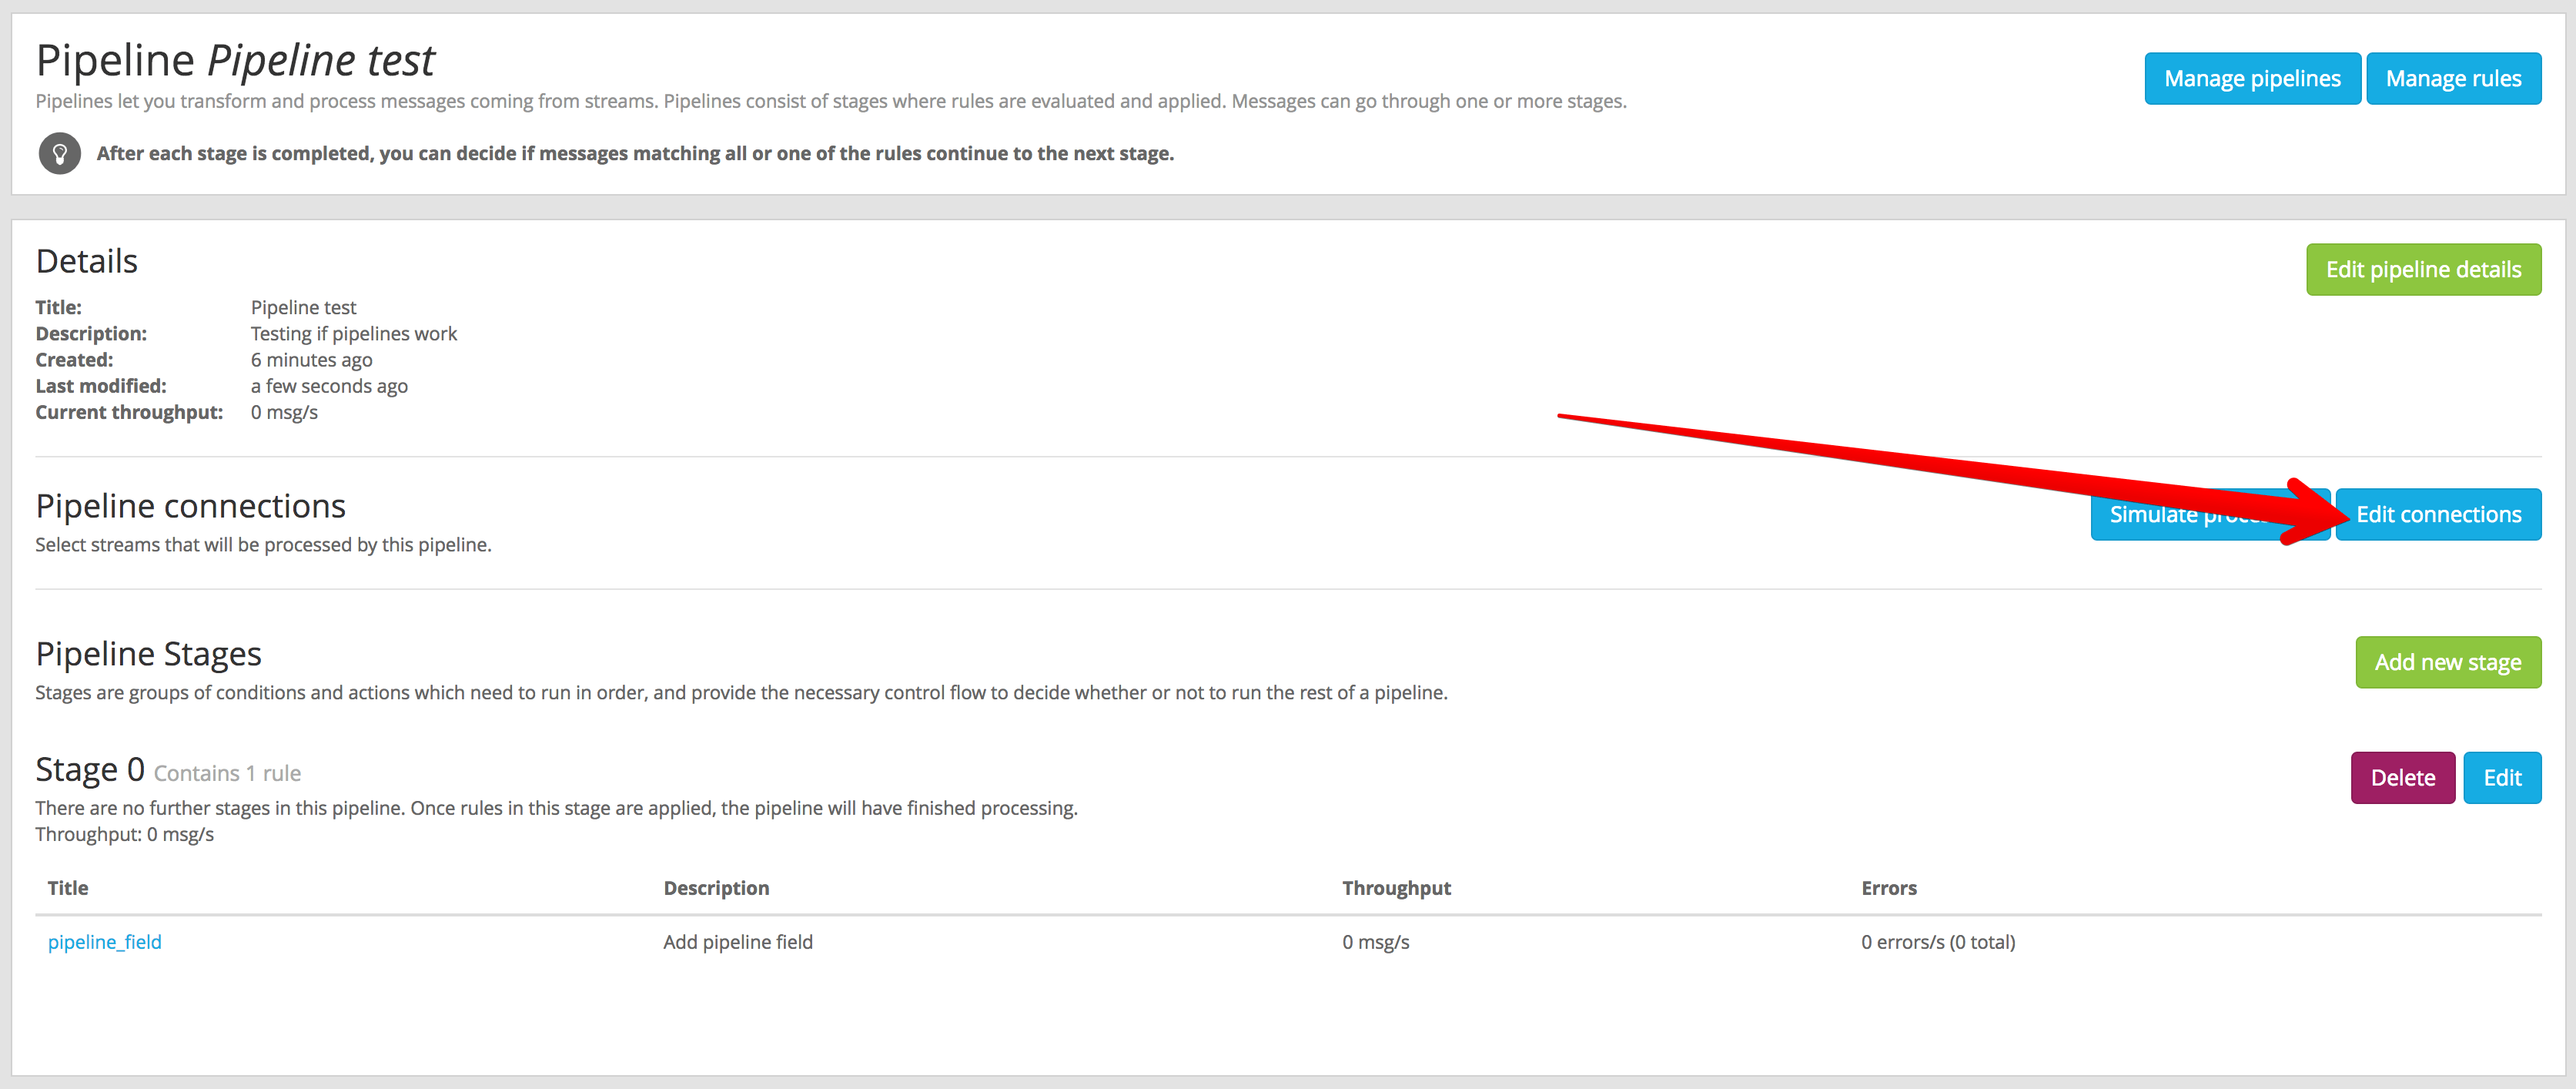
You can assign many pipelines to the same stream, so they are all evaluated for all messages routed into such stream.
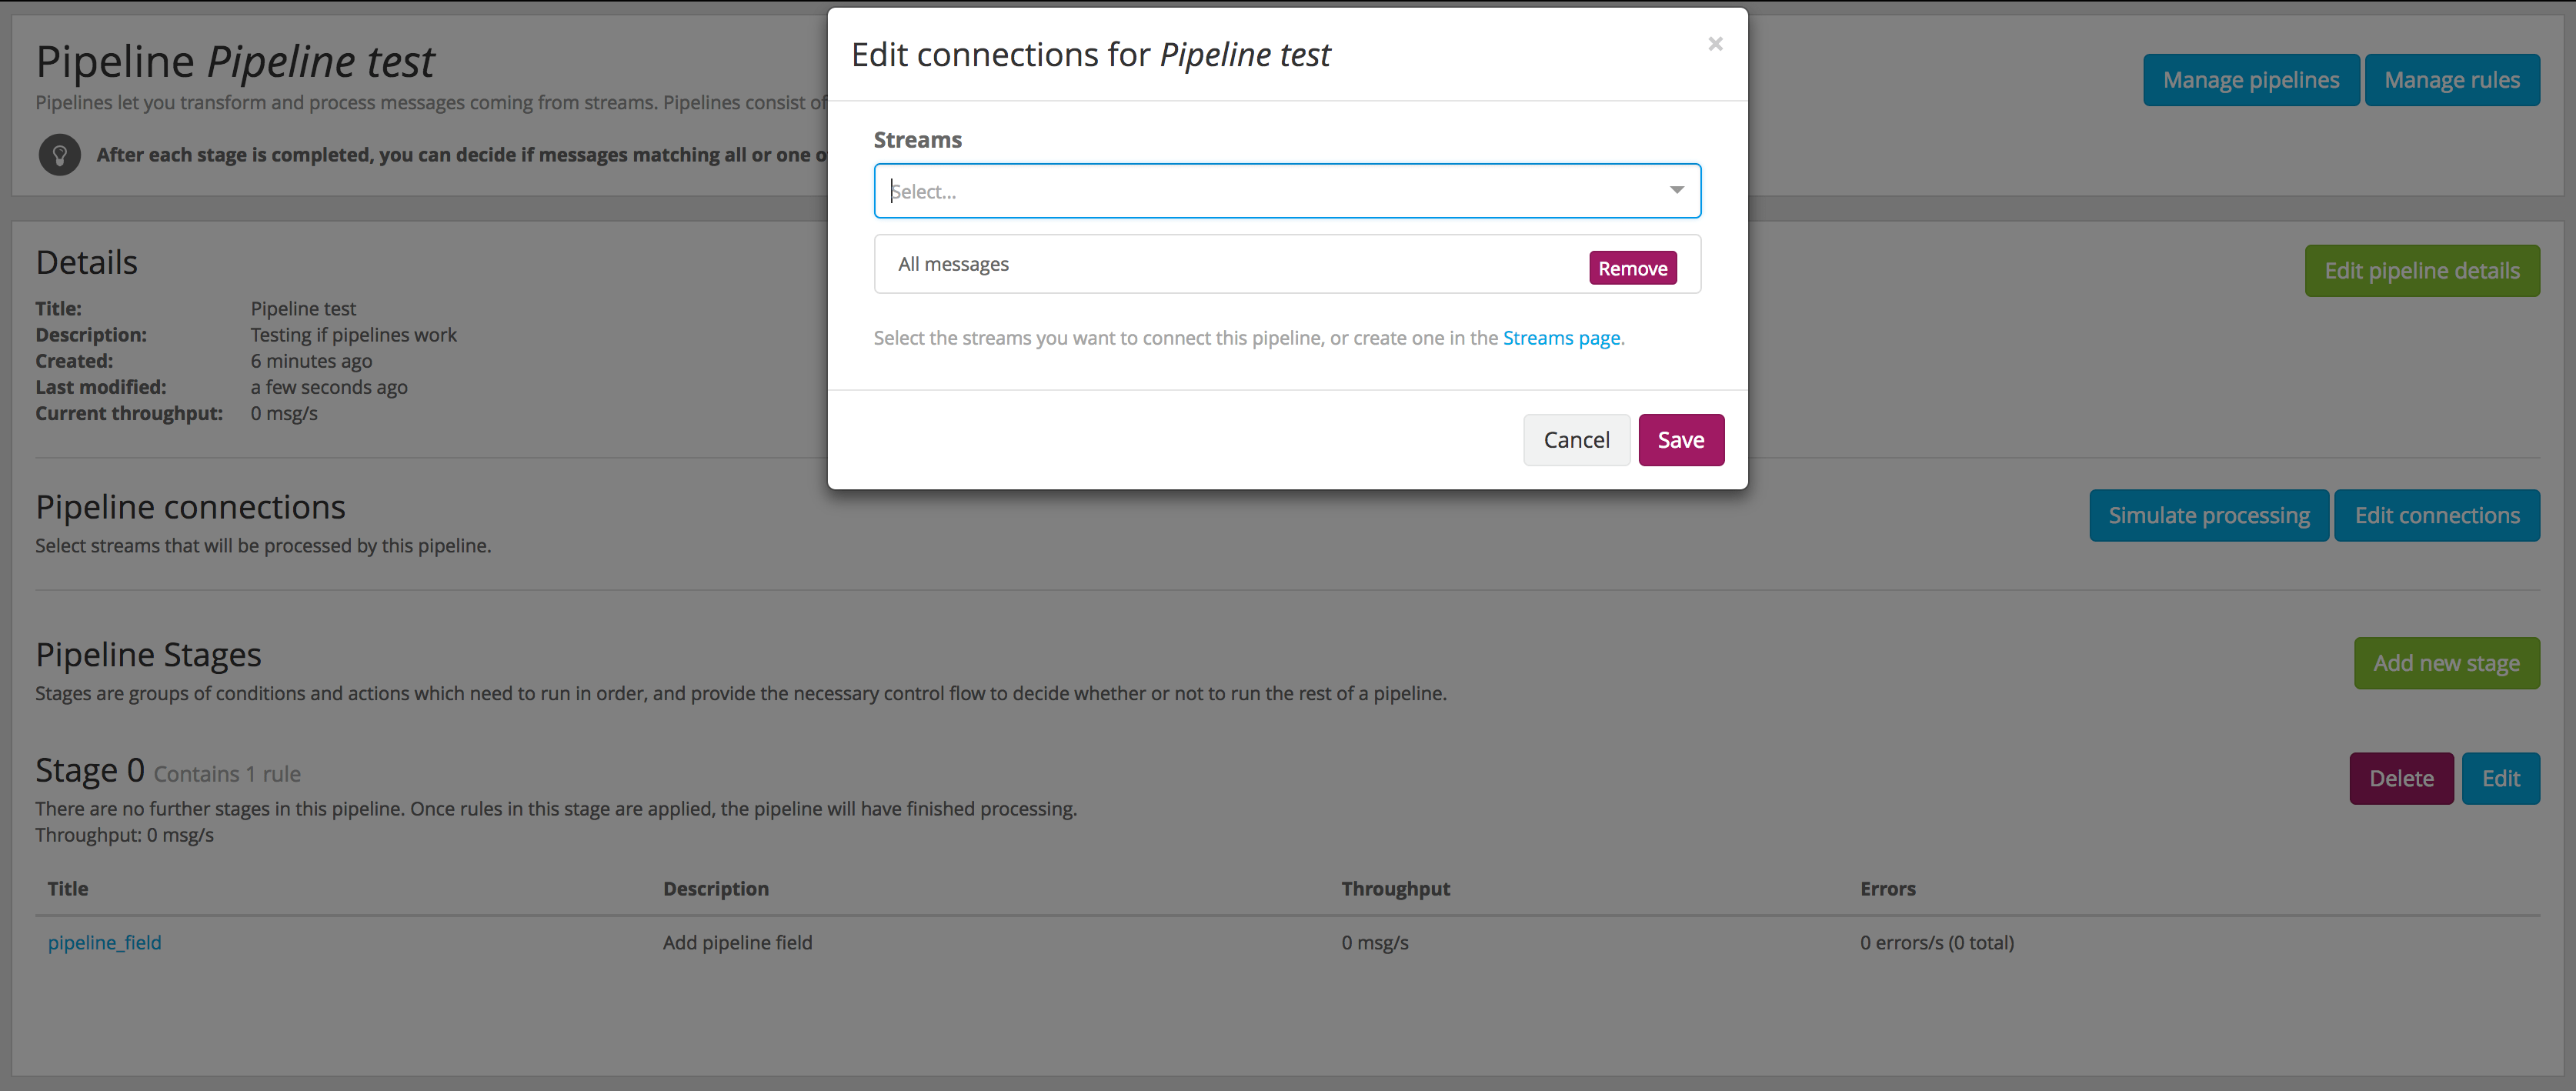
Remember from the Stream connections documentation, that the All messages stream is the one where all messages are routed, and probably a good place to apply pipelines to all your messages.
Simulate your changes
After performing some changes in a processing pipeline, you most likely want to see how they are applied to incoming messages. This is what the pipeline simulator is for.
Click the Simulate processing button under System -> Pipelines or in the pipeline details page to access the pipeline simulator.
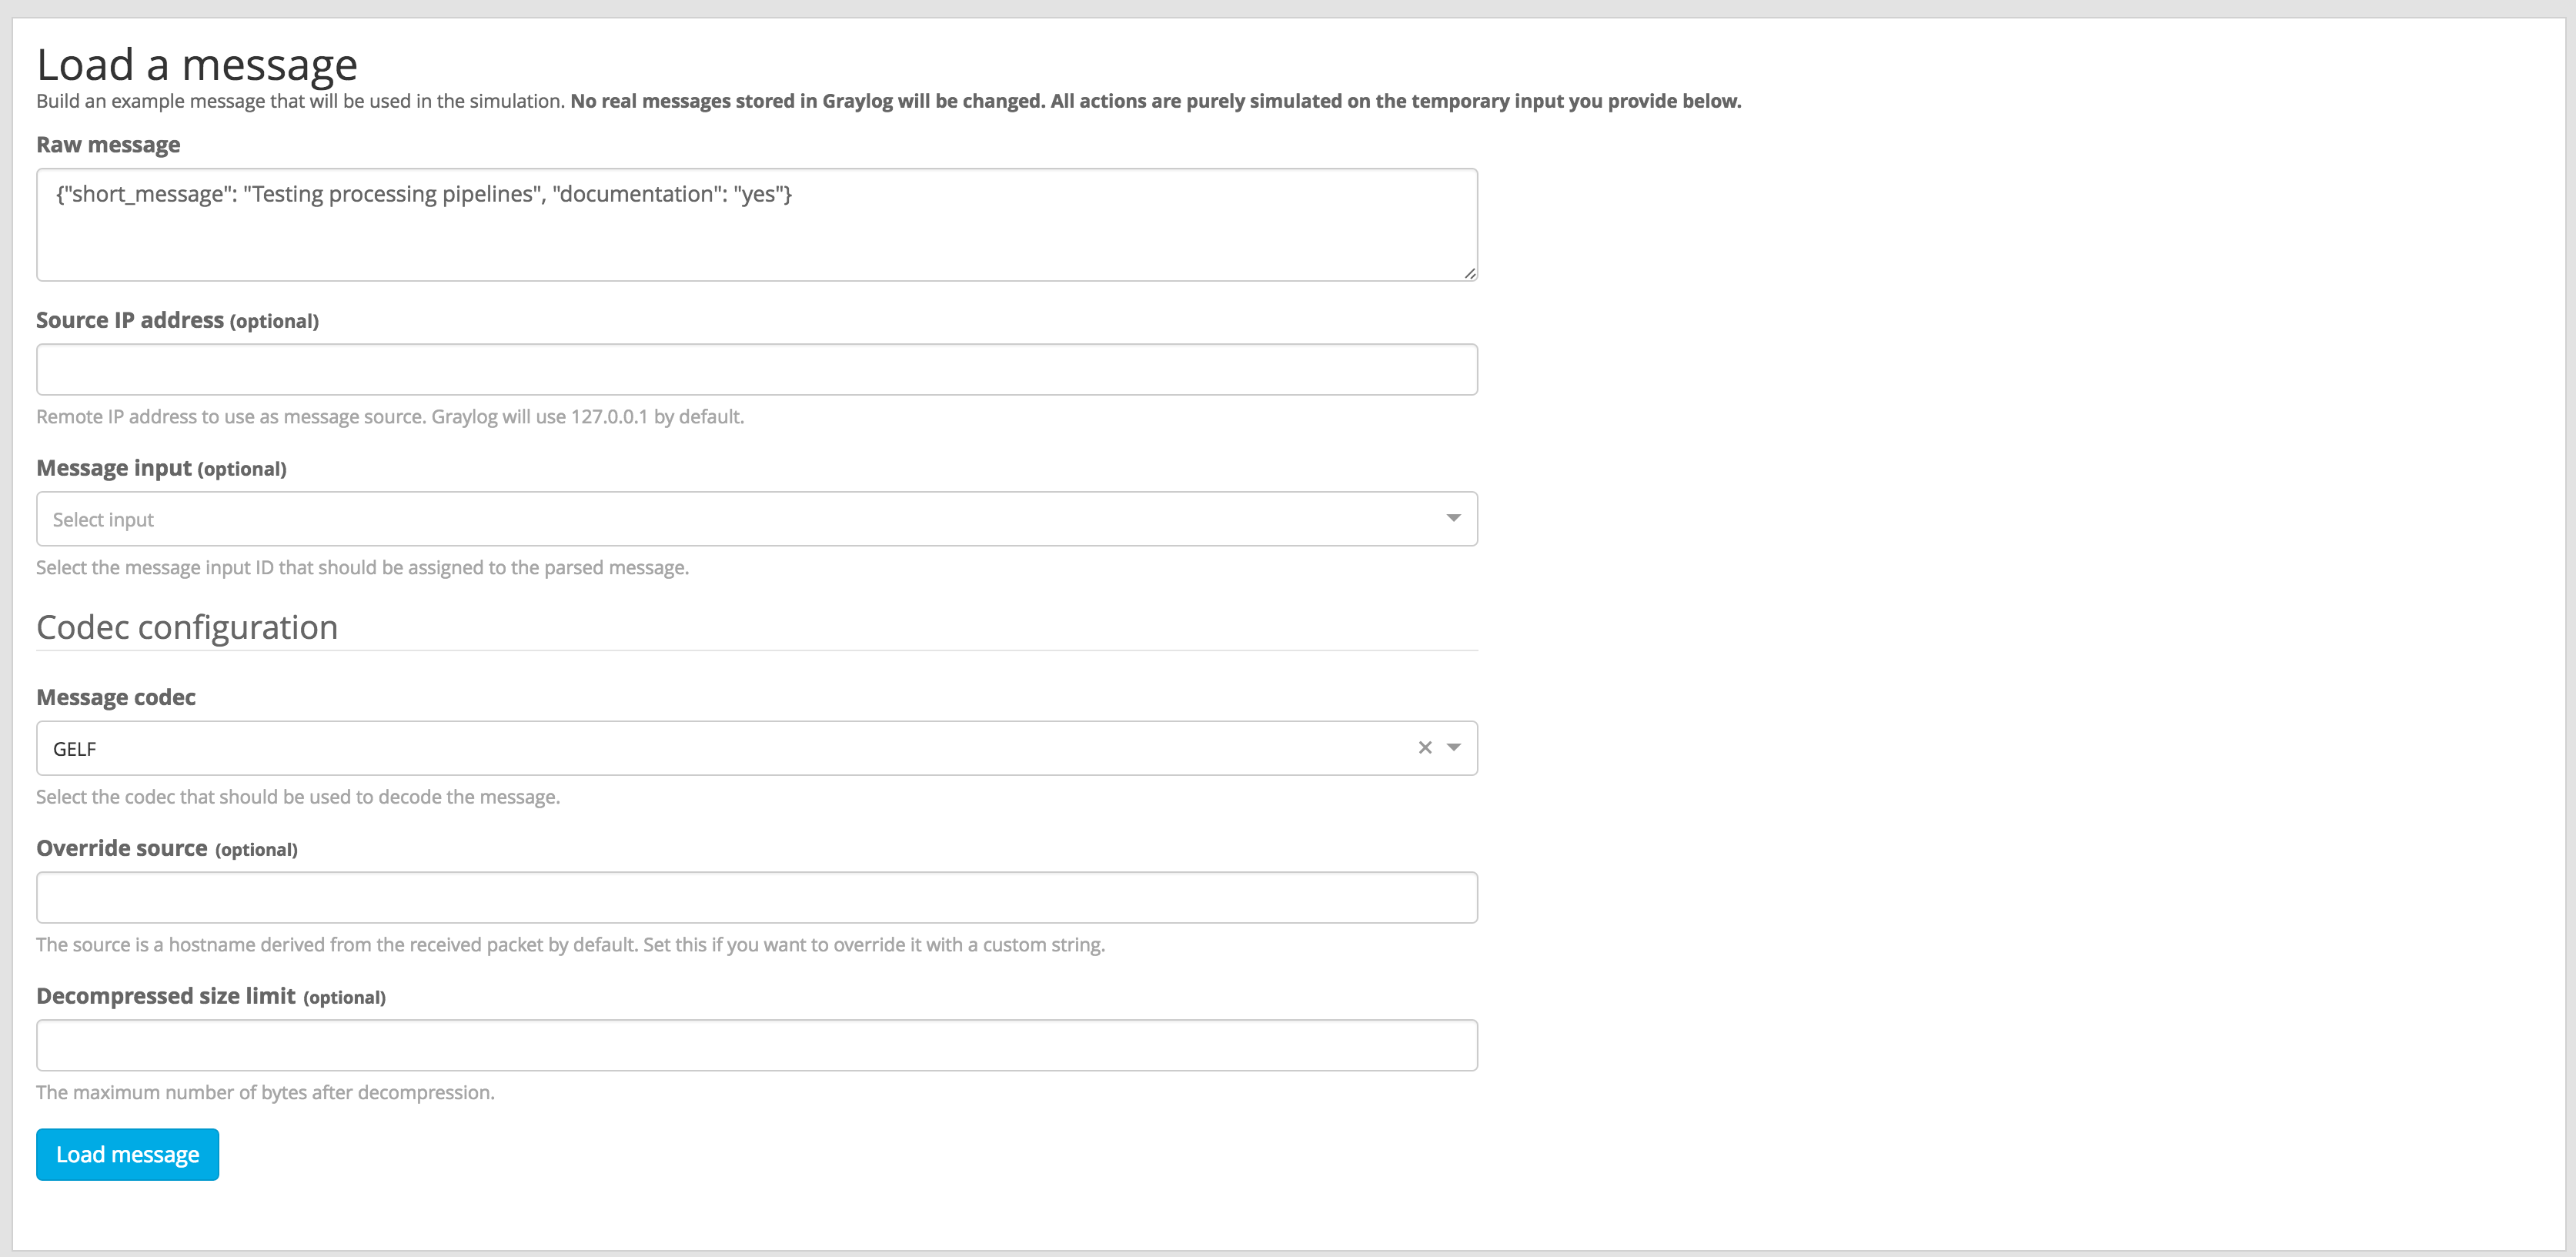
In order to test the message processing, you need to feed a raw message that will be routed into the stream you want to simulate. The raw message should be using the same format as Graylog will receive, for instance, you can type a GELF message in the Raw message field, just as your GELF library would send. Don’t forget to select the right codec for the message you provide.
Once you provide the message and codec to use as example, clicking on Load message will start the simulation, and show the results when they are ready.
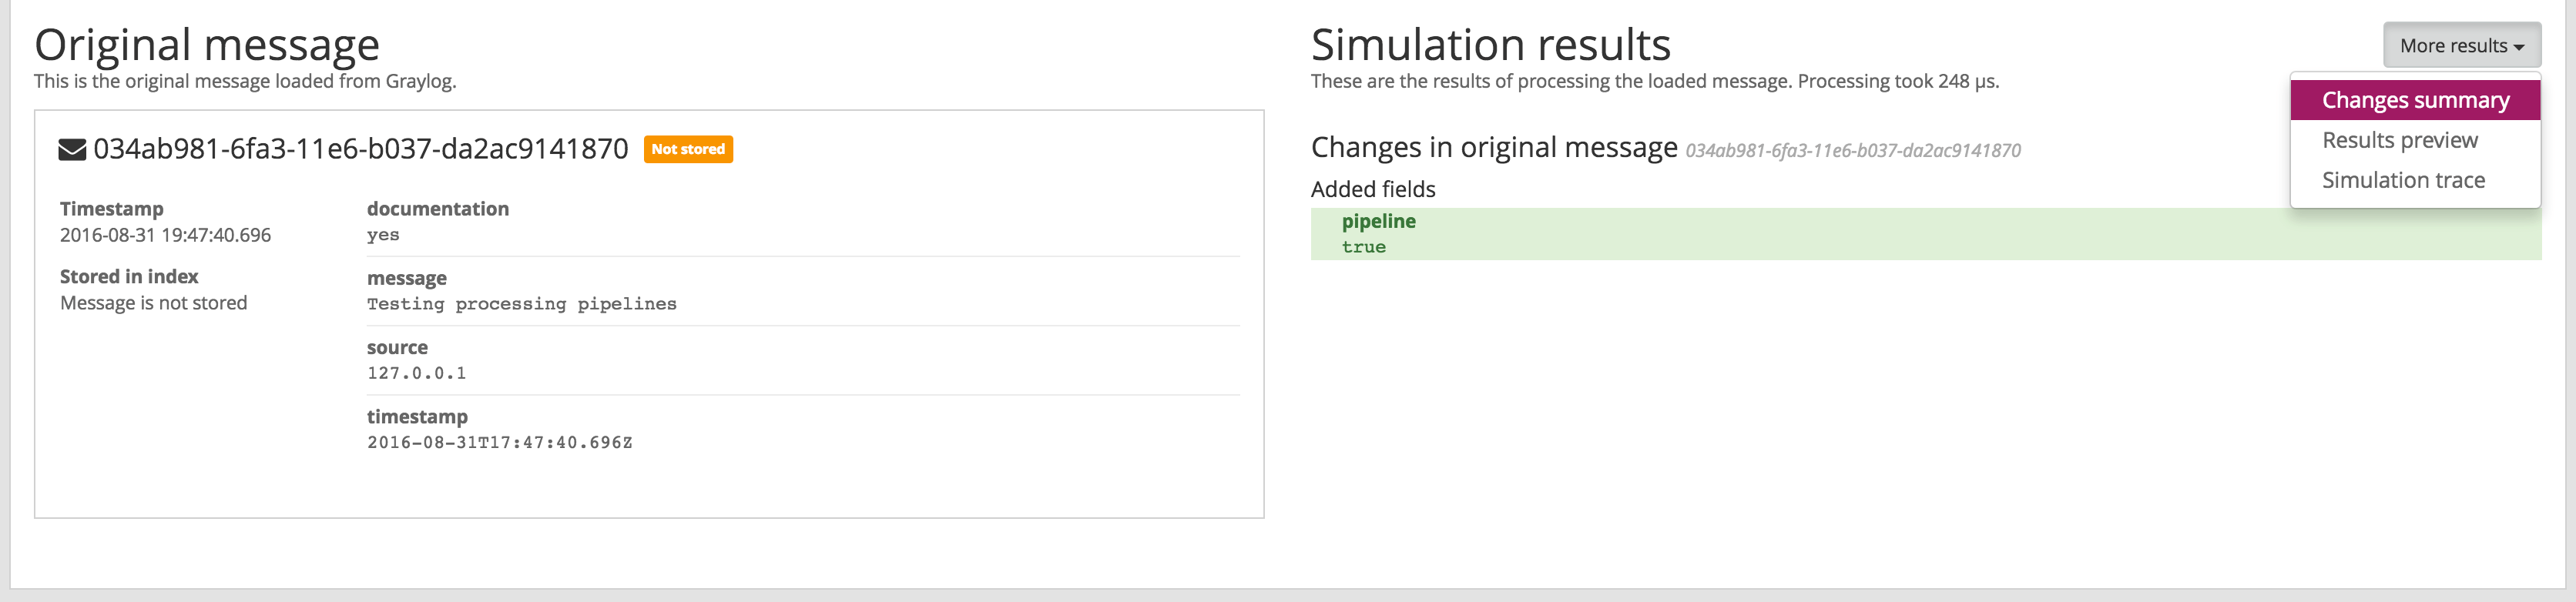
The simulation provides the following results:
- Changes summary
- Provides a summary of modified fields in the original message, and a list of added and dropped messages.
- Results preview
- Shows all fields in the processed message.
- Simulation trace
- Displays a trace of the processing, indicating which rules were evaluated, which were executed. It also includes a timeline in microseconds to allow you to see which rules and pipelines are taking most of the time during message processing.