Collect Messages
Once Graylog and associated components are running, the next step is to begin collecting logs.
The first step is to create an input. Inputs define the method by which Graylog collects logs. Out of the box, Graylog supports multiple methods to collect logs, including:
- Syslog (TCP, UDP, AMQP, Kafka)
- GELF(TCP, UDP, AMQP, Kafka, HTTP)
- AWS - AWS Logs, FlowLogs, CloudTrail
- Beats/Logstash
- CEF (TCP, UDP, AMQP, Kafka)
- JSON Path from HTTP API
- Netflow (UDP)
- Plain/Raw Text (TCP, UDP, AMQP, Kafka)
Content packs
Additional inputs may be installed via content packs. Content packs are bundles of Graylog input, extractor, stream, dashboard, and output configurations that can provide full support for a data source. Some content packs are shipped with Graylog by default and some are available from the website. Content packs that were downloaded from the Graylog Marketplace can be imported using the Graylog web interface.
You can load and even create your own content packs from the System / Content Packs page of the Graylog web interface.
Create an Input
To create an Input, open the System / Inputs page in the top menu, click the arrow in the drop down field, select your input type and click green button labled Launch new input.
Usually, the default settings are correct, but you may change any that you wish. Some input types may require authentication or other information specific to that source.
注解
If Graylog is not running as root, you will not have the option of using ports lower than 1024 for inputs. Sending devices may need to be reconfigured. Since best practice dictates that applications should not be run as root, customers who cannot change the event source are encouraged to use a load balancer, or other external means, to perform port translation.
Save the input. It will start automatically.
If your event source is already configured to send events to the port you selected, in the case of push event sources like Syslog or CEF, you should start to recieve messages within a few seconds.
Check out Sending in log data if you’d like to learn more about the supported options for ingesting messages into Graylog.
Verify Messages Are Being Collected
Once you have an input defined, you will want to verify that you are receiving messages on that input. Check the Throughput / Metrics section to the right of your input. You should see the NetworkIO values start to climb, showing the amount of data consumed on this input.
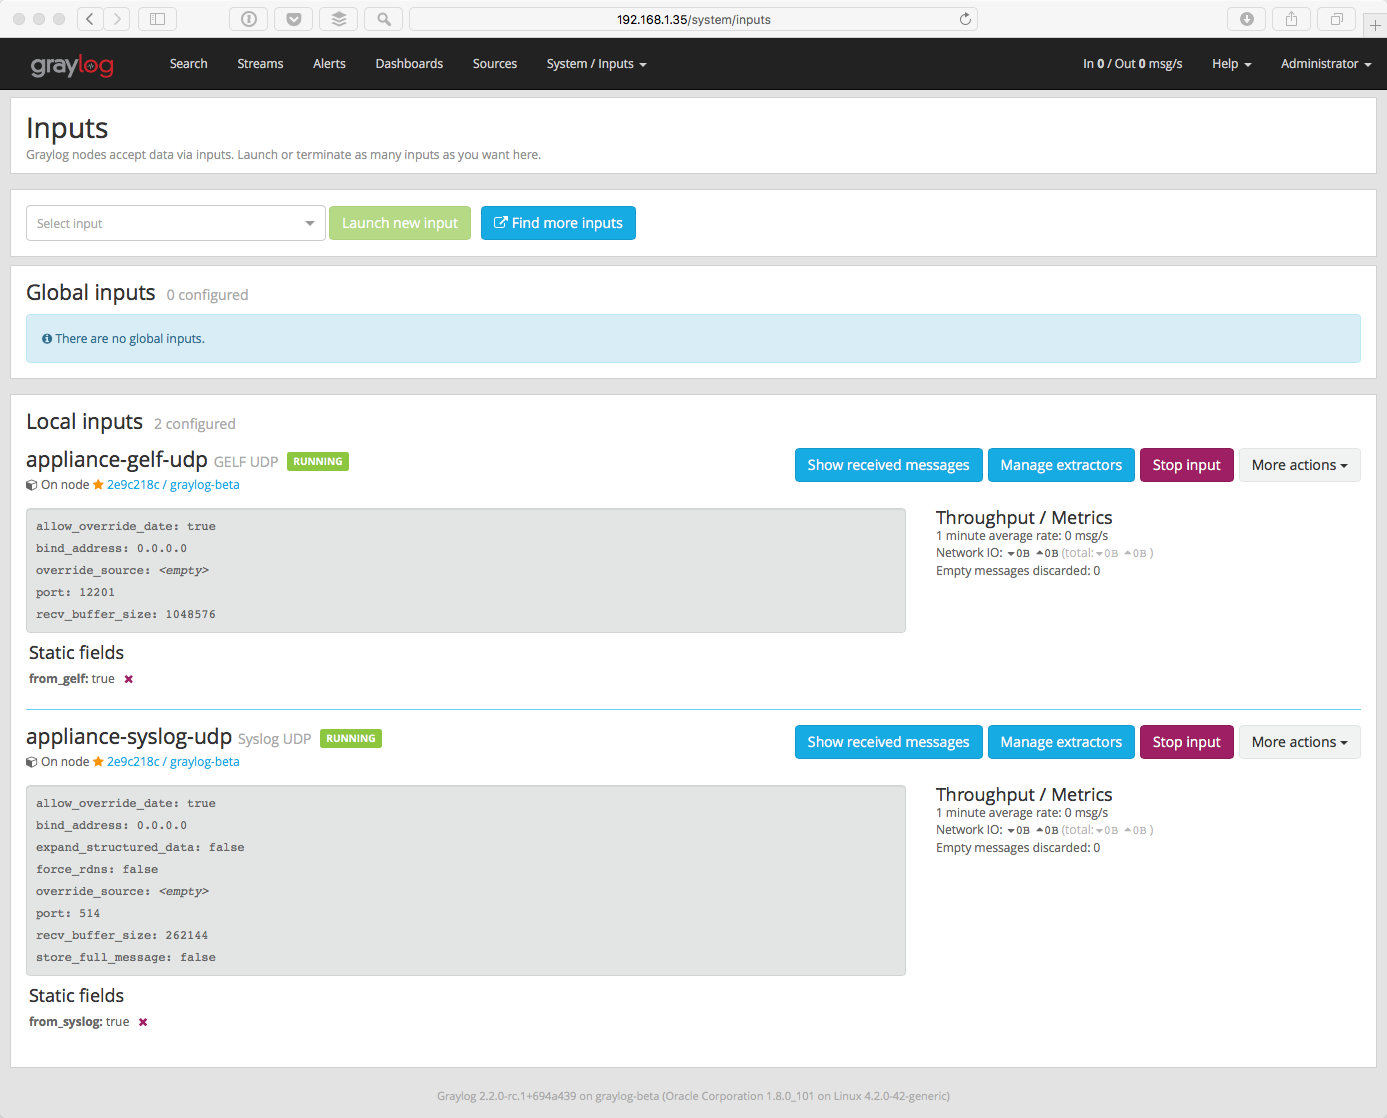
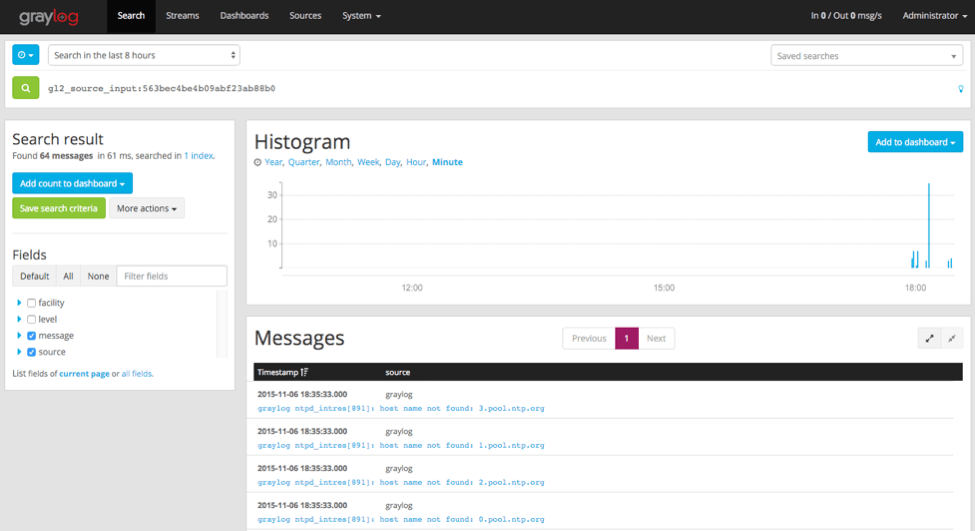
Click on the Show received messages button next to the input you just created. You should now see the messages received on this input.
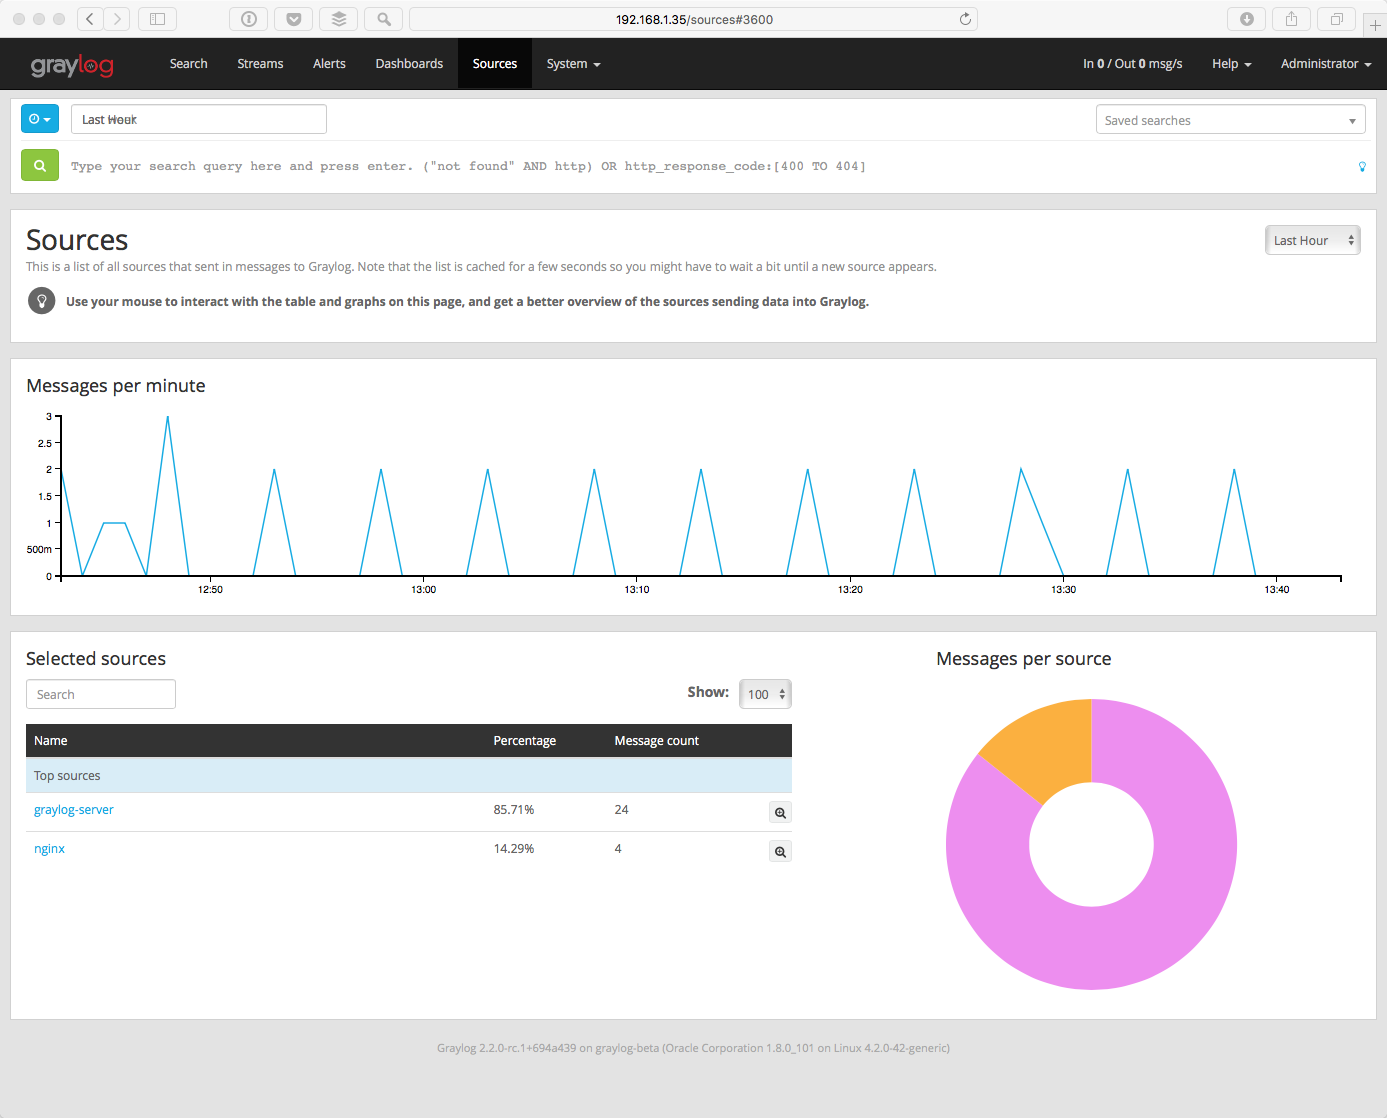
If you click on Sources in the top menu, you will see a nice overview of all devices, servers or applications that are sending data into Graylog and how many messages has received from each source. Initially, you may not see much on this page. However, once you start sending data from more systems, their hostnames or IP addresses will also be listed on this page.
Skip the following section if you are all good.
If You Don’t Have Messages
- Check to see that you made the proper entries in the input configuration described above.
- Check the configuration at the event source and make sure that it matches the ports and other options defined in the input. For example, if you changed the port for a Syslog UDP input to 5014, be sure the sending device has that same port defined.
- Check to see if traffic is coming to the defined port. You can use the tcpdump command to do this:
$ sudo tcpdump -i lo host 127.0.0.1 and udp port 5014
- Check to see if the server is listening on the host:
$ sudo netstat -peanut | grep ":5014"
If you still have issues, connect to our community support or get in touch with us via the professional support offering.