Create Your Dashboard
You’ve got data coming in, so let’s create a dashboard to better visualize the data we want to see.
Add a Dashboard
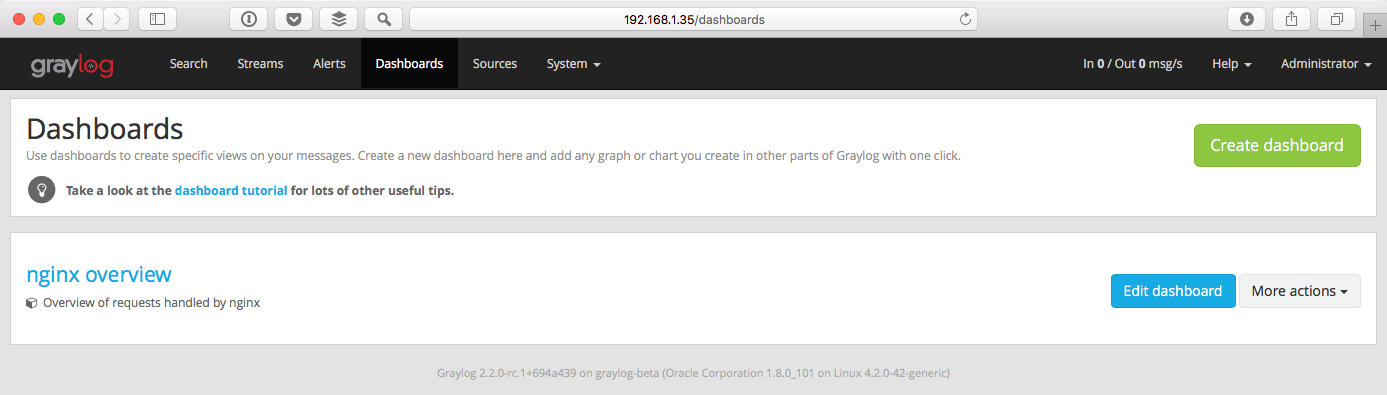
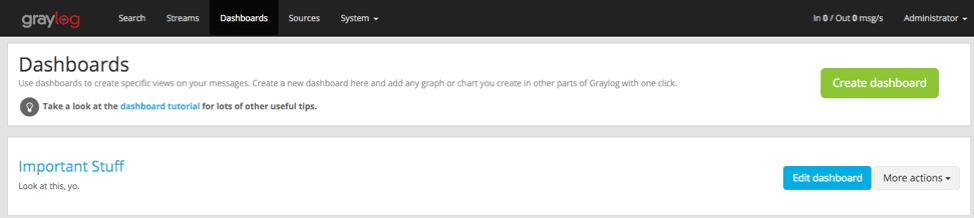
Open the Dashboards page in the top menu and then click on Create dashboard.
Give your new dashboard a title and description, and click Save.
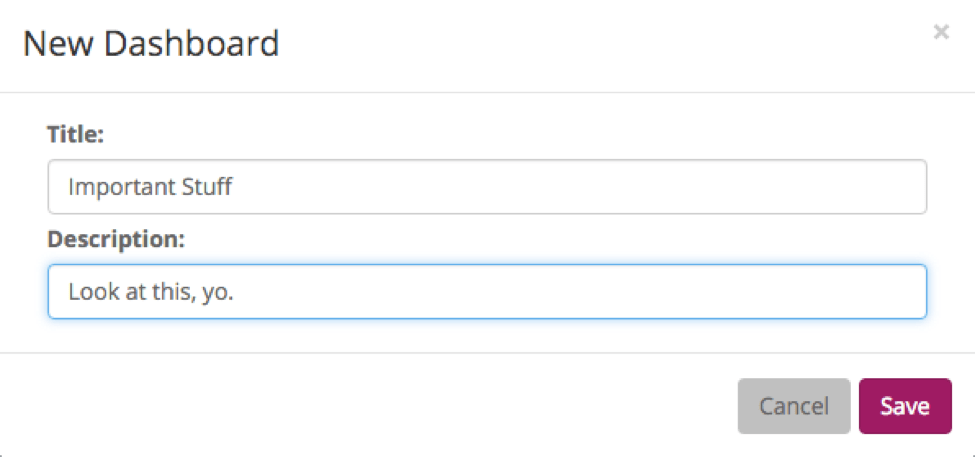
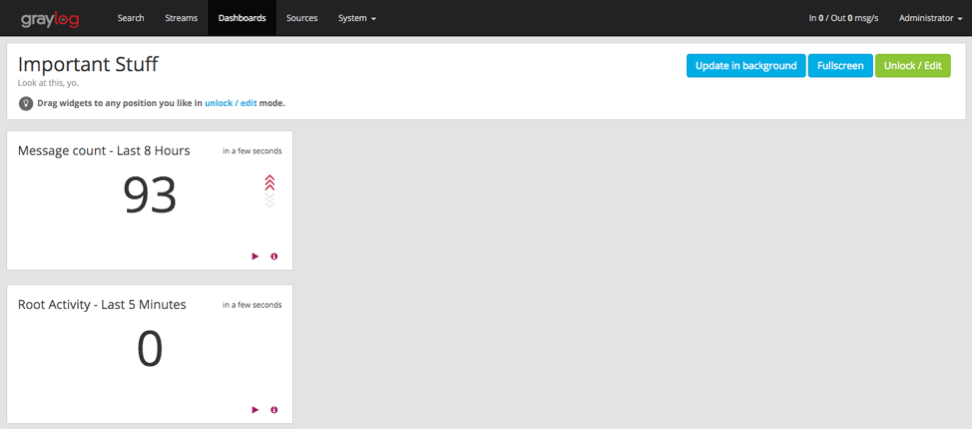
In this example the title is Important Stuff and the description Look at this, yo.
We have a blank dashboard, which isn’t very interesting. Let’s add a widget!
Add a Dashboard Widget
Navigate to the System / Inputs page and click the “Show received messages” button next to the appliance-syslog-udp input. This is how we show only the messages received by this input.
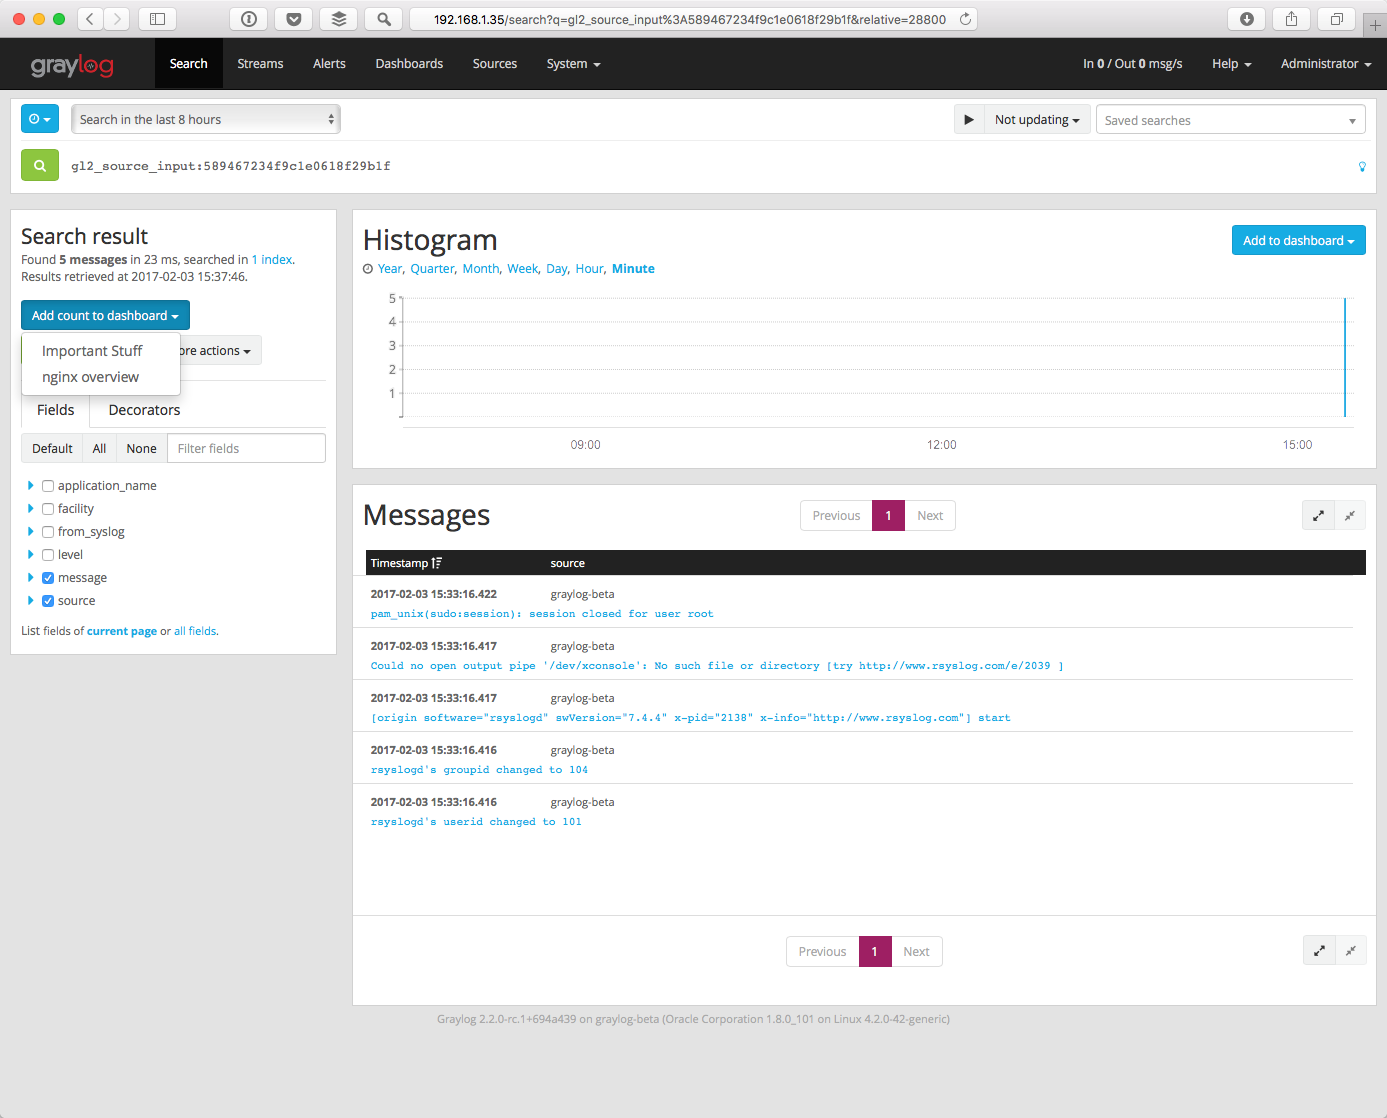
We’ll start by adding a widget with the message count. Click on Add count to dashboard (in the Search result pane) and select our newly-created dashboard Important Stuff.
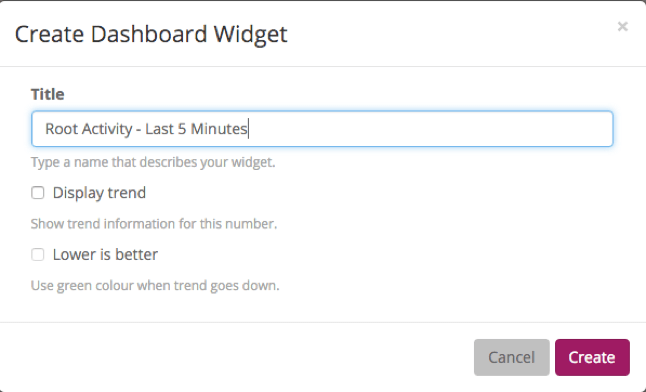
Now you’ll be prompted for some information about the widget. In this case, we are creating a widget from our search result of message count in the last 8 hours. I like to put a timeframe in the title, and trends are always a big bowl of sunshine.
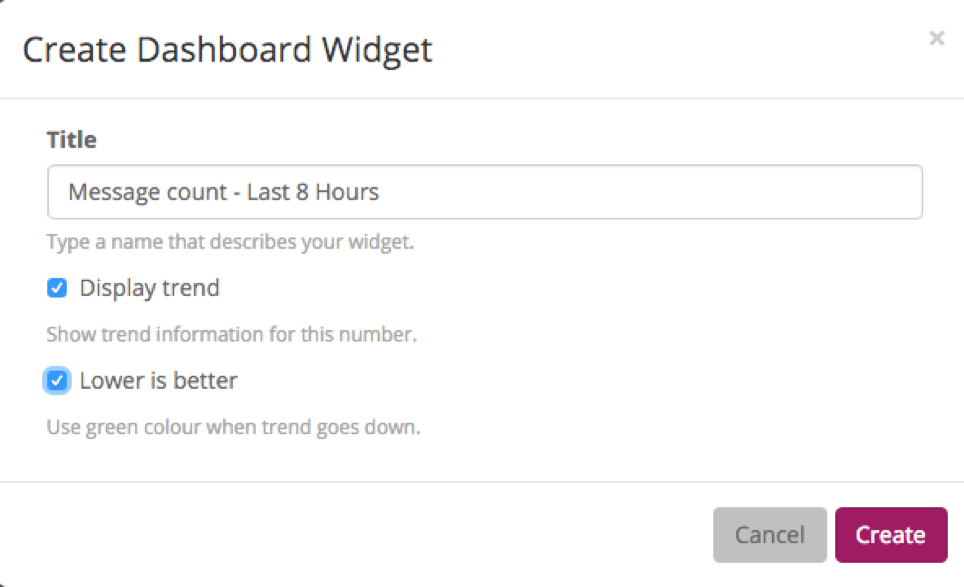
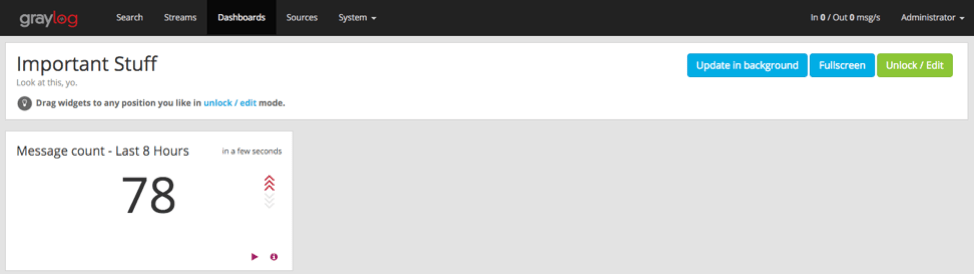
When you hit Create you will see a small green notification at the bottom of the page. Navigate to the Dashboards page, and then click on the name of your dashboard (Important Stuff).
Extra Credit - One more
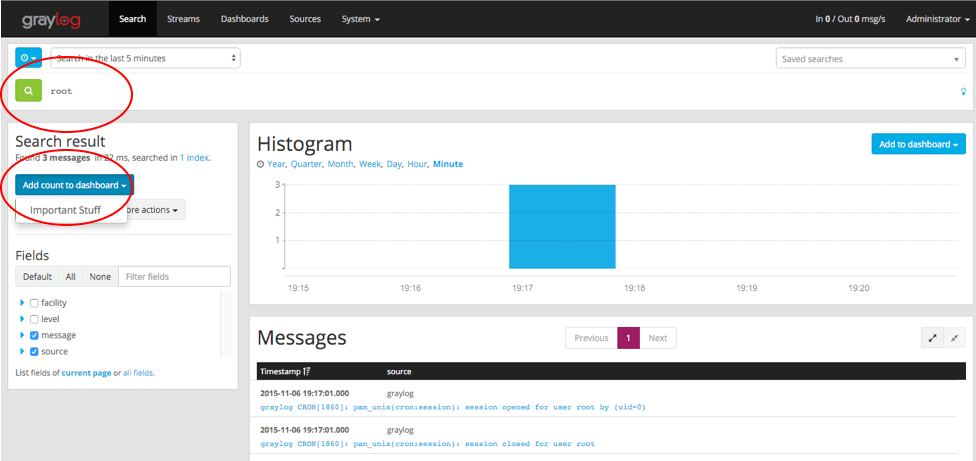
Let’s add a widget for root activity, because that sounds like it may actually be useful. We need to start with a search query for root. Click Search. Type “root” in the search box and select your desired timeframe. Once the search results come in, click Add count to the dashboard and, as before, select your dashboard (Important Stuff).
Give your chart a title and hit Create.
The new widget is now on the screen. Good job - you’ve got this!
Go play around. If you want to know how to create more exciting charts and graphs, check out the section below.
Extra Credit - Graphs
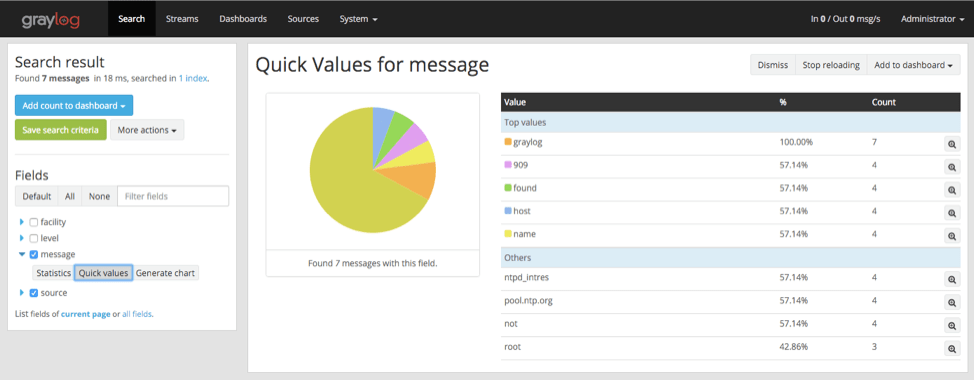
Let’s start by searching for all messages within the last 1 hour. To do this, click Search, select Search in the last 1 hour, and leave the search bar blank. Once the search results populate, expand the message field in the Search result sidebar and select Quick Values. Click Add to dashboard to add this entire pie chart and data table to your dashboard.
I like to track password changes, privilege assignments, root activity, system events, user logins, etc. Go knock yourself out and show your co-workers.
You can always click a dashboard’s Unlock / Edit button to quickly edit, delete, or rearrange any widget. Make sure to click Lock to save!
You can find out why dashboards matter at our Dashboard documentation.
Next, let’s get alerted!